Game Analytics (Riders of Asgard)...

In the last couple of releases, I included some analytics for Riders of Asgard so that we could start working out trends and identifying areas that we can focus on or improve.
The core of the system uses Google Analytics which has a plugin on Unreal Engine and you merely need to wire up the various events and/or screens and the system happily starts logging to you Google Analytics system.
Here are some of the results that are quite interesting.
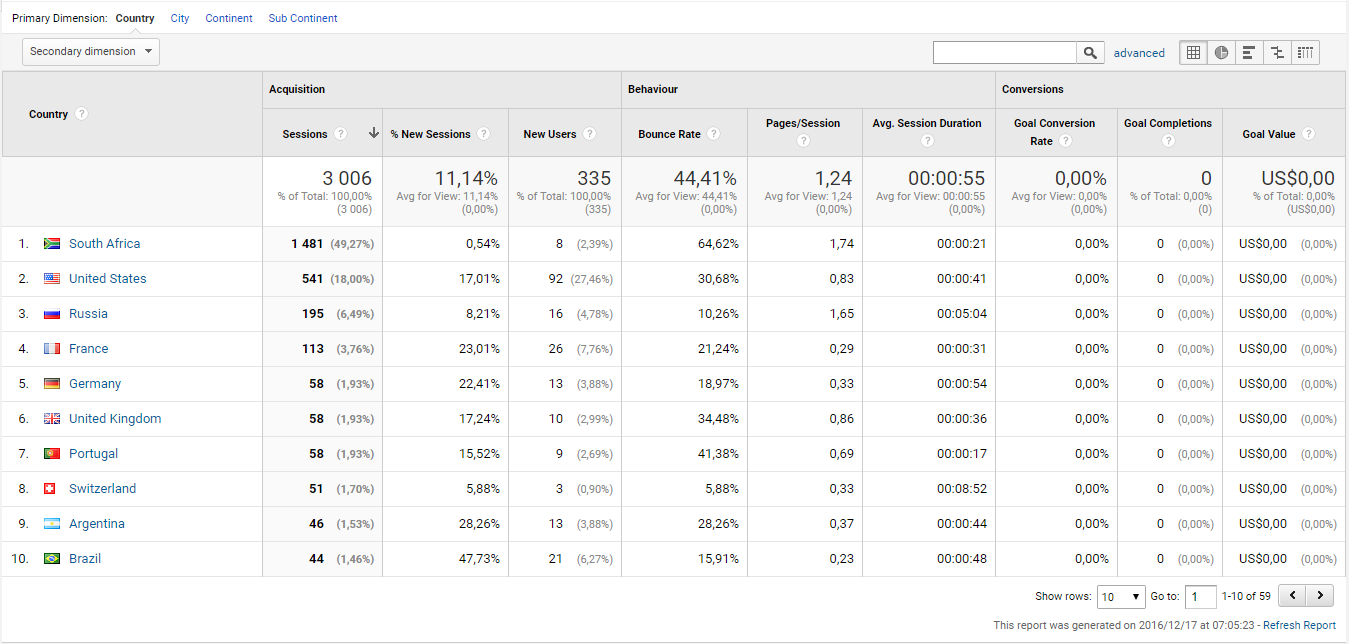
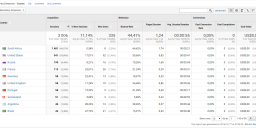
Countries: This has allowed me to identify the core languages that we should focus for I18N (Internationalization) support.
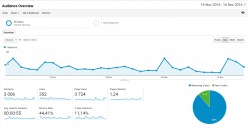
Overview: So here we can see that we have sessions every day, which means people are playing the game every day but our new visitors value is quite low. So although we are retaining our existing players we are not hooking as many new players as we would like ... now there are various factors here but it might be time for a small scale marketing campaign to see if we can improve these numbers.

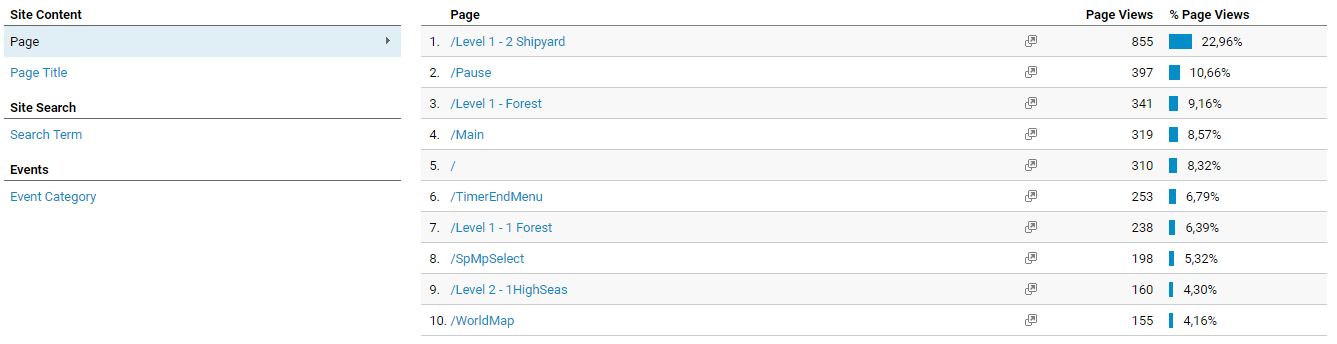
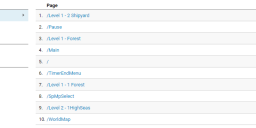
Pages (Screens): So here we can track where the players are spending most of their times and obviously the new map that was just released (Shipyard) is getting the most activity. It seems as if the village map is absent from the list and so maybe it is time to tweak the map a little ... once again there are various factors that may be involved here and we would have to track the trends over a longer period (this is just a month) before we absolutely decided to change something.
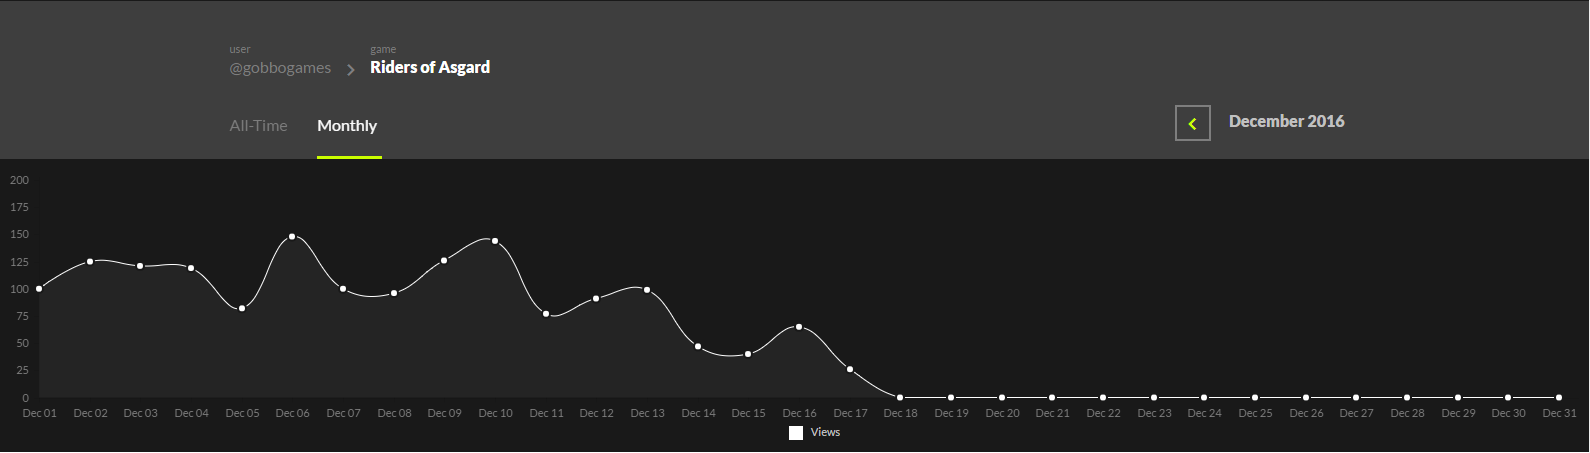
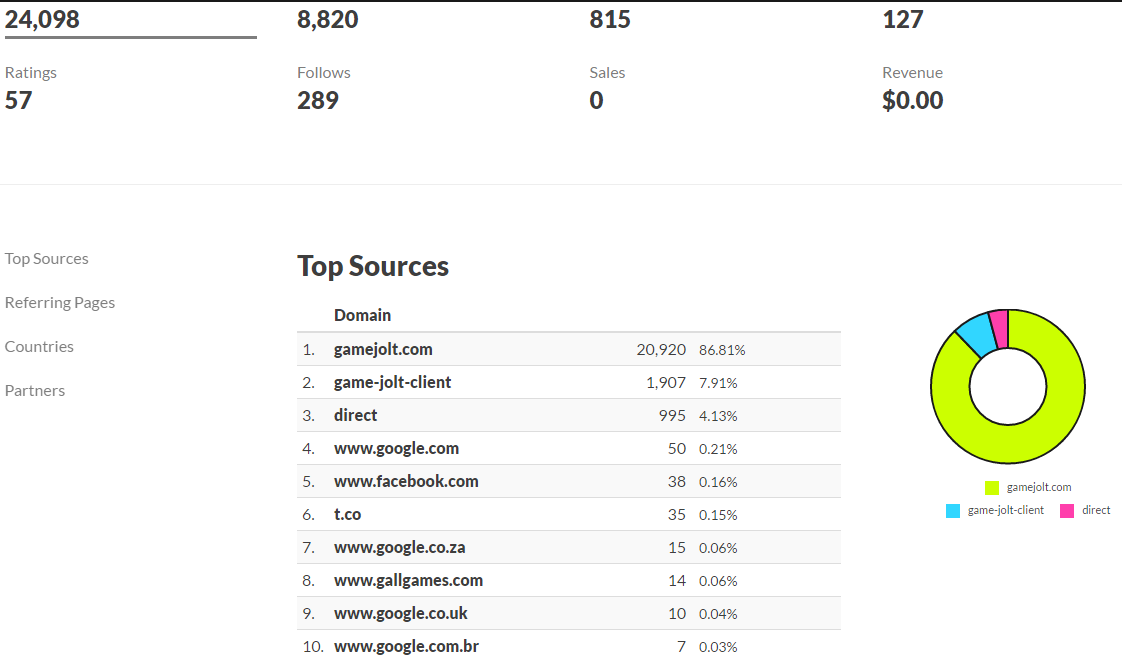
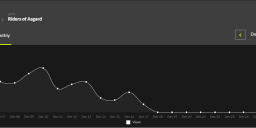
So as you can see, from briefly analysing some of the data I have been able to decide on a few ways forward with regards to the project. The trends that I see on Google Analytics also match what I am seeing from the Game Jolt page with regards to people constantly playing the game ... so this means we are getting the plays we need ... which makes me happy. 8-}
So in my opinion, analytics are pretty important for your game. If you do implement it, implement it earlier rather than later as you will get more meaningful data in the long run. I have found the analytics invaluable in helping us shape the game from a navigation and user experience point of view all the way to the content we provide.
As a Business Analyst once said ... some analytics is better than no analytics. 8-}
The core of the system uses Google Analytics which has a plugin on Unreal Engine and you merely need to wire up the various events and/or screens and the system happily starts logging to you Google Analytics system.
Here are some of the results that are quite interesting.
Countries: This has allowed me to identify the core languages that we should focus for I18N (Internationalization) support.
Overview: So here we can see that we have sessions every day, which means people are playing the game every day but our new visitors value is quite low. So although we are retaining our existing players we are not hooking as many new players as we would like ... now there are various factors here but it might be time for a small scale marketing campaign to see if we can improve these numbers.
Pages (Screens): So here we can track where the players are spending most of their times and obviously the new map that was just released (Shipyard) is getting the most activity. It seems as if the village map is absent from the list and so maybe it is time to tweak the map a little ... once again there are various factors that may be involved here and we would have to track the trends over a longer period (this is just a month) before we absolutely decided to change something.
So as you can see, from briefly analysing some of the data I have been able to decide on a few ways forward with regards to the project. The trends that I see on Google Analytics also match what I am seeing from the Game Jolt page with regards to people constantly playing the game ... so this means we are getting the plays we need ... which makes me happy. 8-}
So in my opinion, analytics are pretty important for your game. If you do implement it, implement it earlier rather than later as you will get more meaningful data in the long run. I have found the analytics invaluable in helping us shape the game from a navigation and user experience point of view all the way to the content we provide.
As a Business Analyst once said ... some analytics is better than no analytics. 8-}
Languages.PNG
1349 x 644 - 103K
Overview.PNG
1342 x 694 - 66K
Pages.PNG
1337 x 344 - 30K
GameJolt.PNG
1590 x 453 - 28K

AllTime.PNG
1122 x 663 - 50K
Comments
Would you consider implementing something like a heat map, for tracking where your players are failing... and particularly where they are failing before they quit (if that's possible).
We found with Broforce, that when we were tracking players, we could get some insight into which levels of the campaign were frustrating players by looking at where they dropped off from playing. We ended up tweaking the levels quite a lot based on this data (and in fact scrapping whole styles of levels that just were causing too much grief).
Not sure if the same metrics are relevant to your game though. I guess if you're seeing more play on certain levels that means that the design of those levels are engaging players the most (and that might be enough information already).
This tracking will allow me to see what the most popular game modes are, what level they are playing those game modes on, and how long they are spending in a session.
The thing with analytics is that you can't just implement it and leave it, it needs to be tweaked and changed as your game progresses, so every release of the game has some time dedicated to reviewing the analytics and making the necessary changes. 8-}